Immigration Numbers
When it comes to immigration, numbers matter. Here you will find some of the most important facts and figures about U.S. immigration policy. You can also run your own population projections under different immigration scenarios. See how small annual changes in immigration lead to BIG differences in future population numbers.
Legal Permanent Immigration by Decade
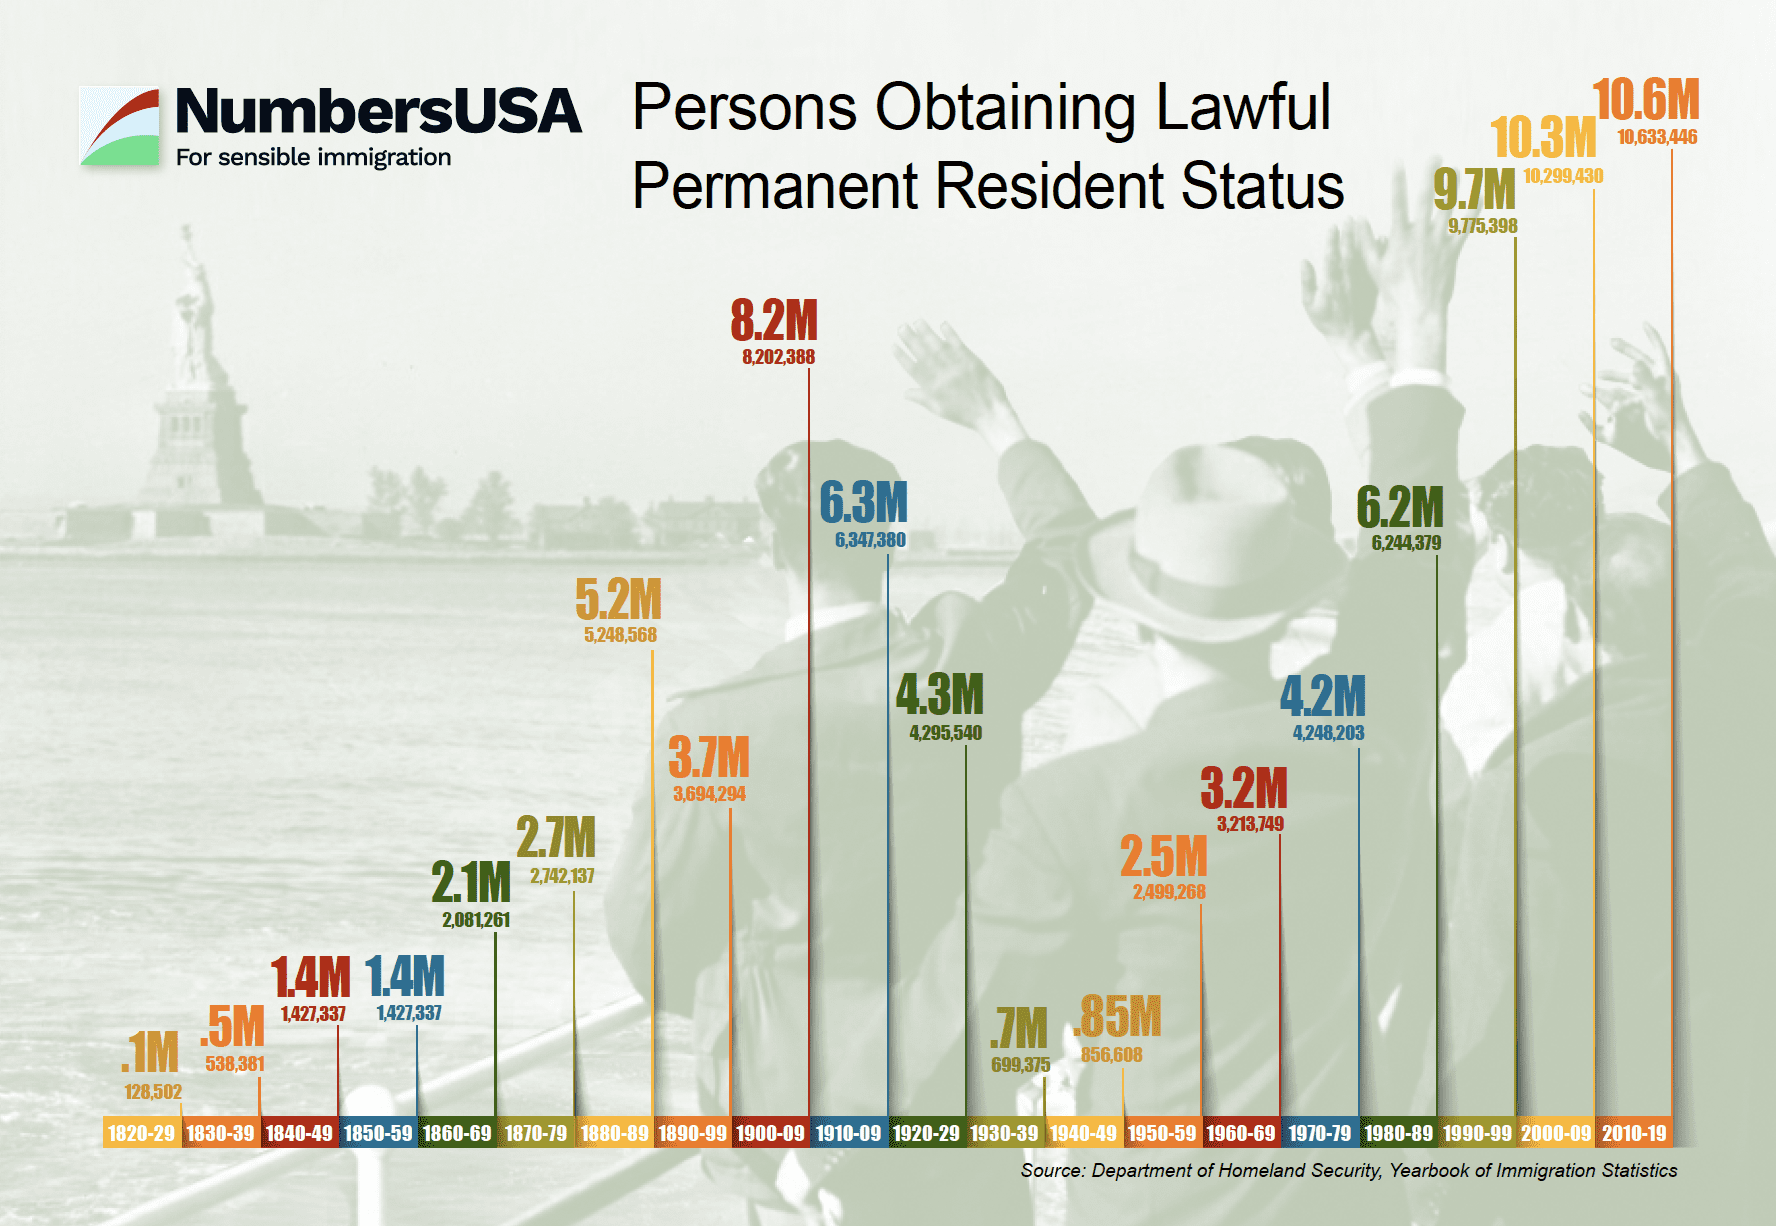
Immigration numbers are a matter of public policy. They can vary greatly from year to year and decade to decade, depending on what levels are set by Congress and whether Presidential administrations choose to enforce immigration laws. Recent years have seen the highest immigration levels in U.S. history.
United States Population Projections (in millions) Under Three Different Immigration Scenarios
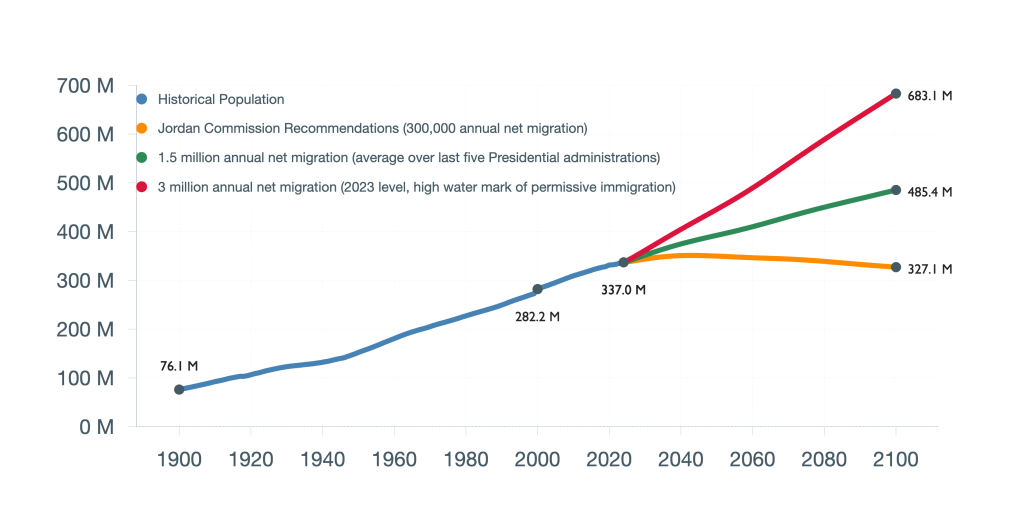
The U.S. population doubled during the past seventy years, from 170 million in 1955 to 340 million today. Because U.S. citizens have largely chosen to have small families, future immigration levels will determine whether our population stabilizes or continues to grow during this century. Continuing current immigration levels will increase our population by about 150 million more people by 2100.
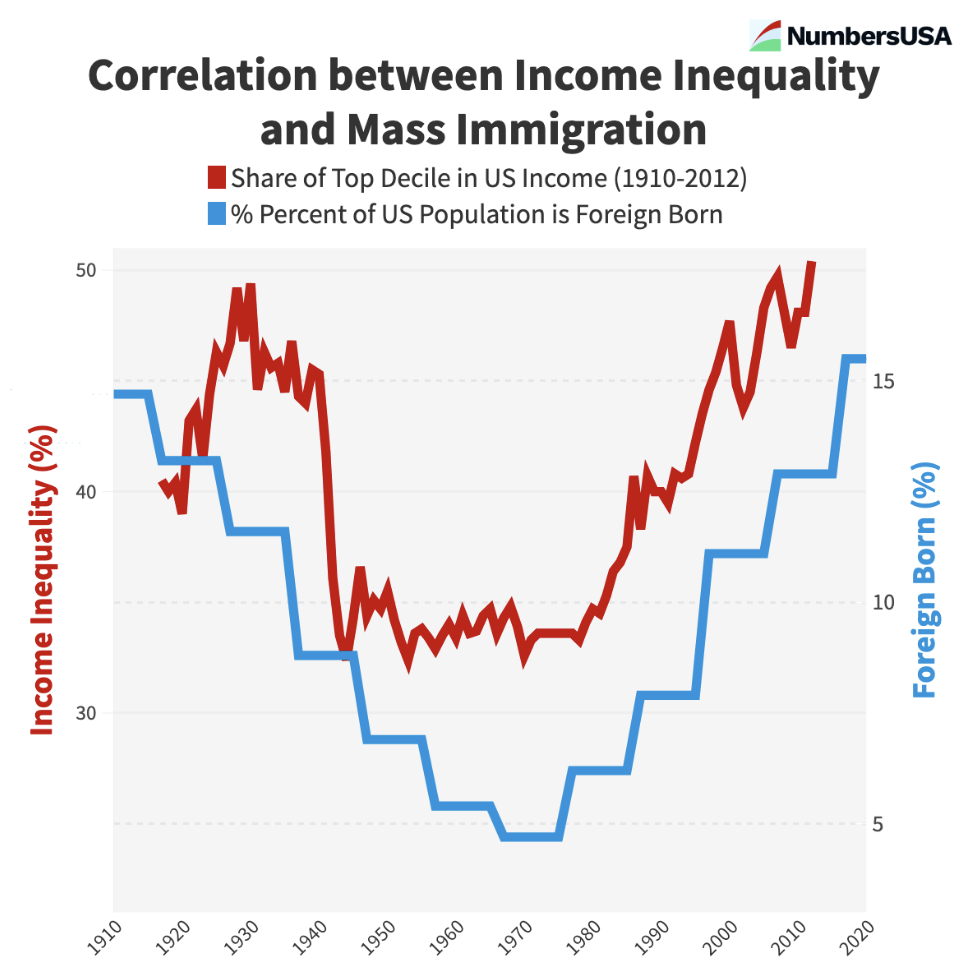
Flooding labor markets drives down wages. Over the past five decades, immigration has been highest in lower-wage sectors of the economy. Resulting downward pressure on workers’ wages has disproportionately harmed the poorest workers and driven up economic inequality in the United States.
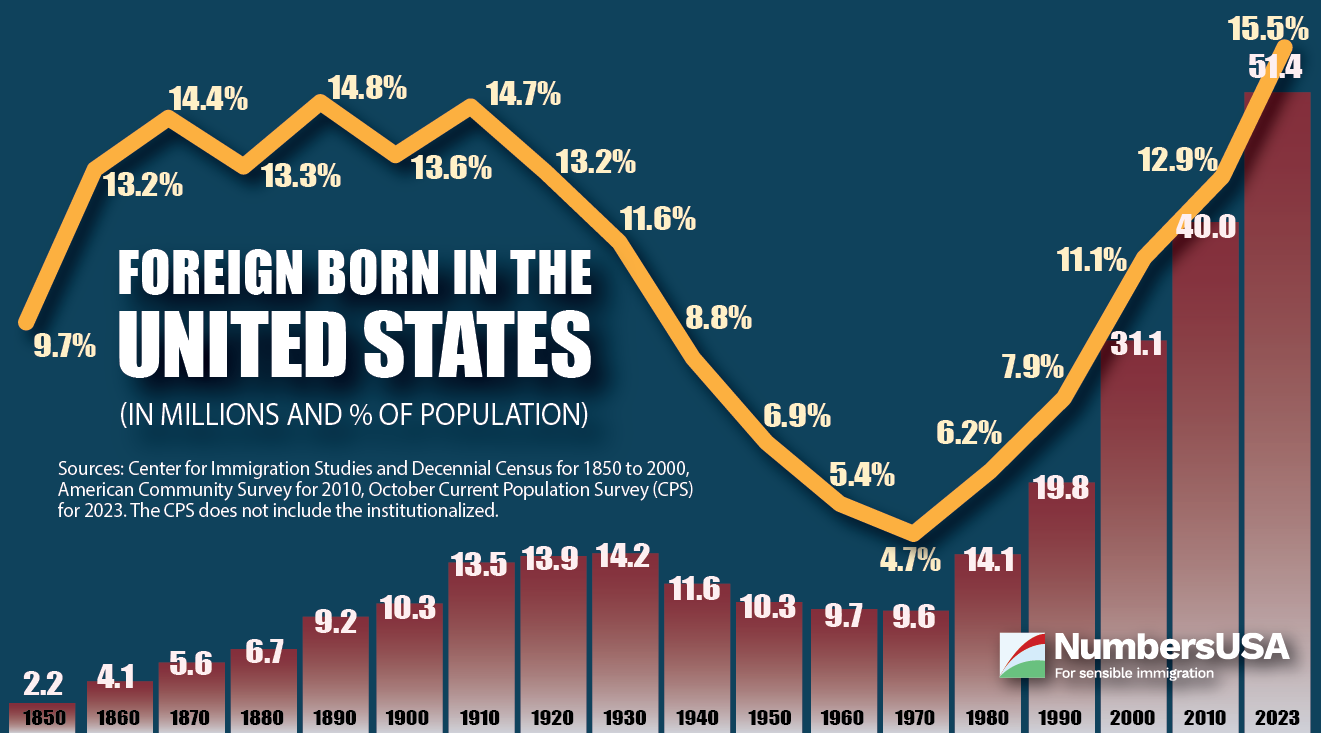
As immigration levels have climbed in recent decades, the numbers and the percentage of U.S. residents born in other countries have increased to their highest levels in history. Americans pride ourselves on being a nation of immigrants. But we may have overestimated how high we could push immigration levels while maintaining a generous economic safety net and sustaining a middle-class society.
Migrant Categories
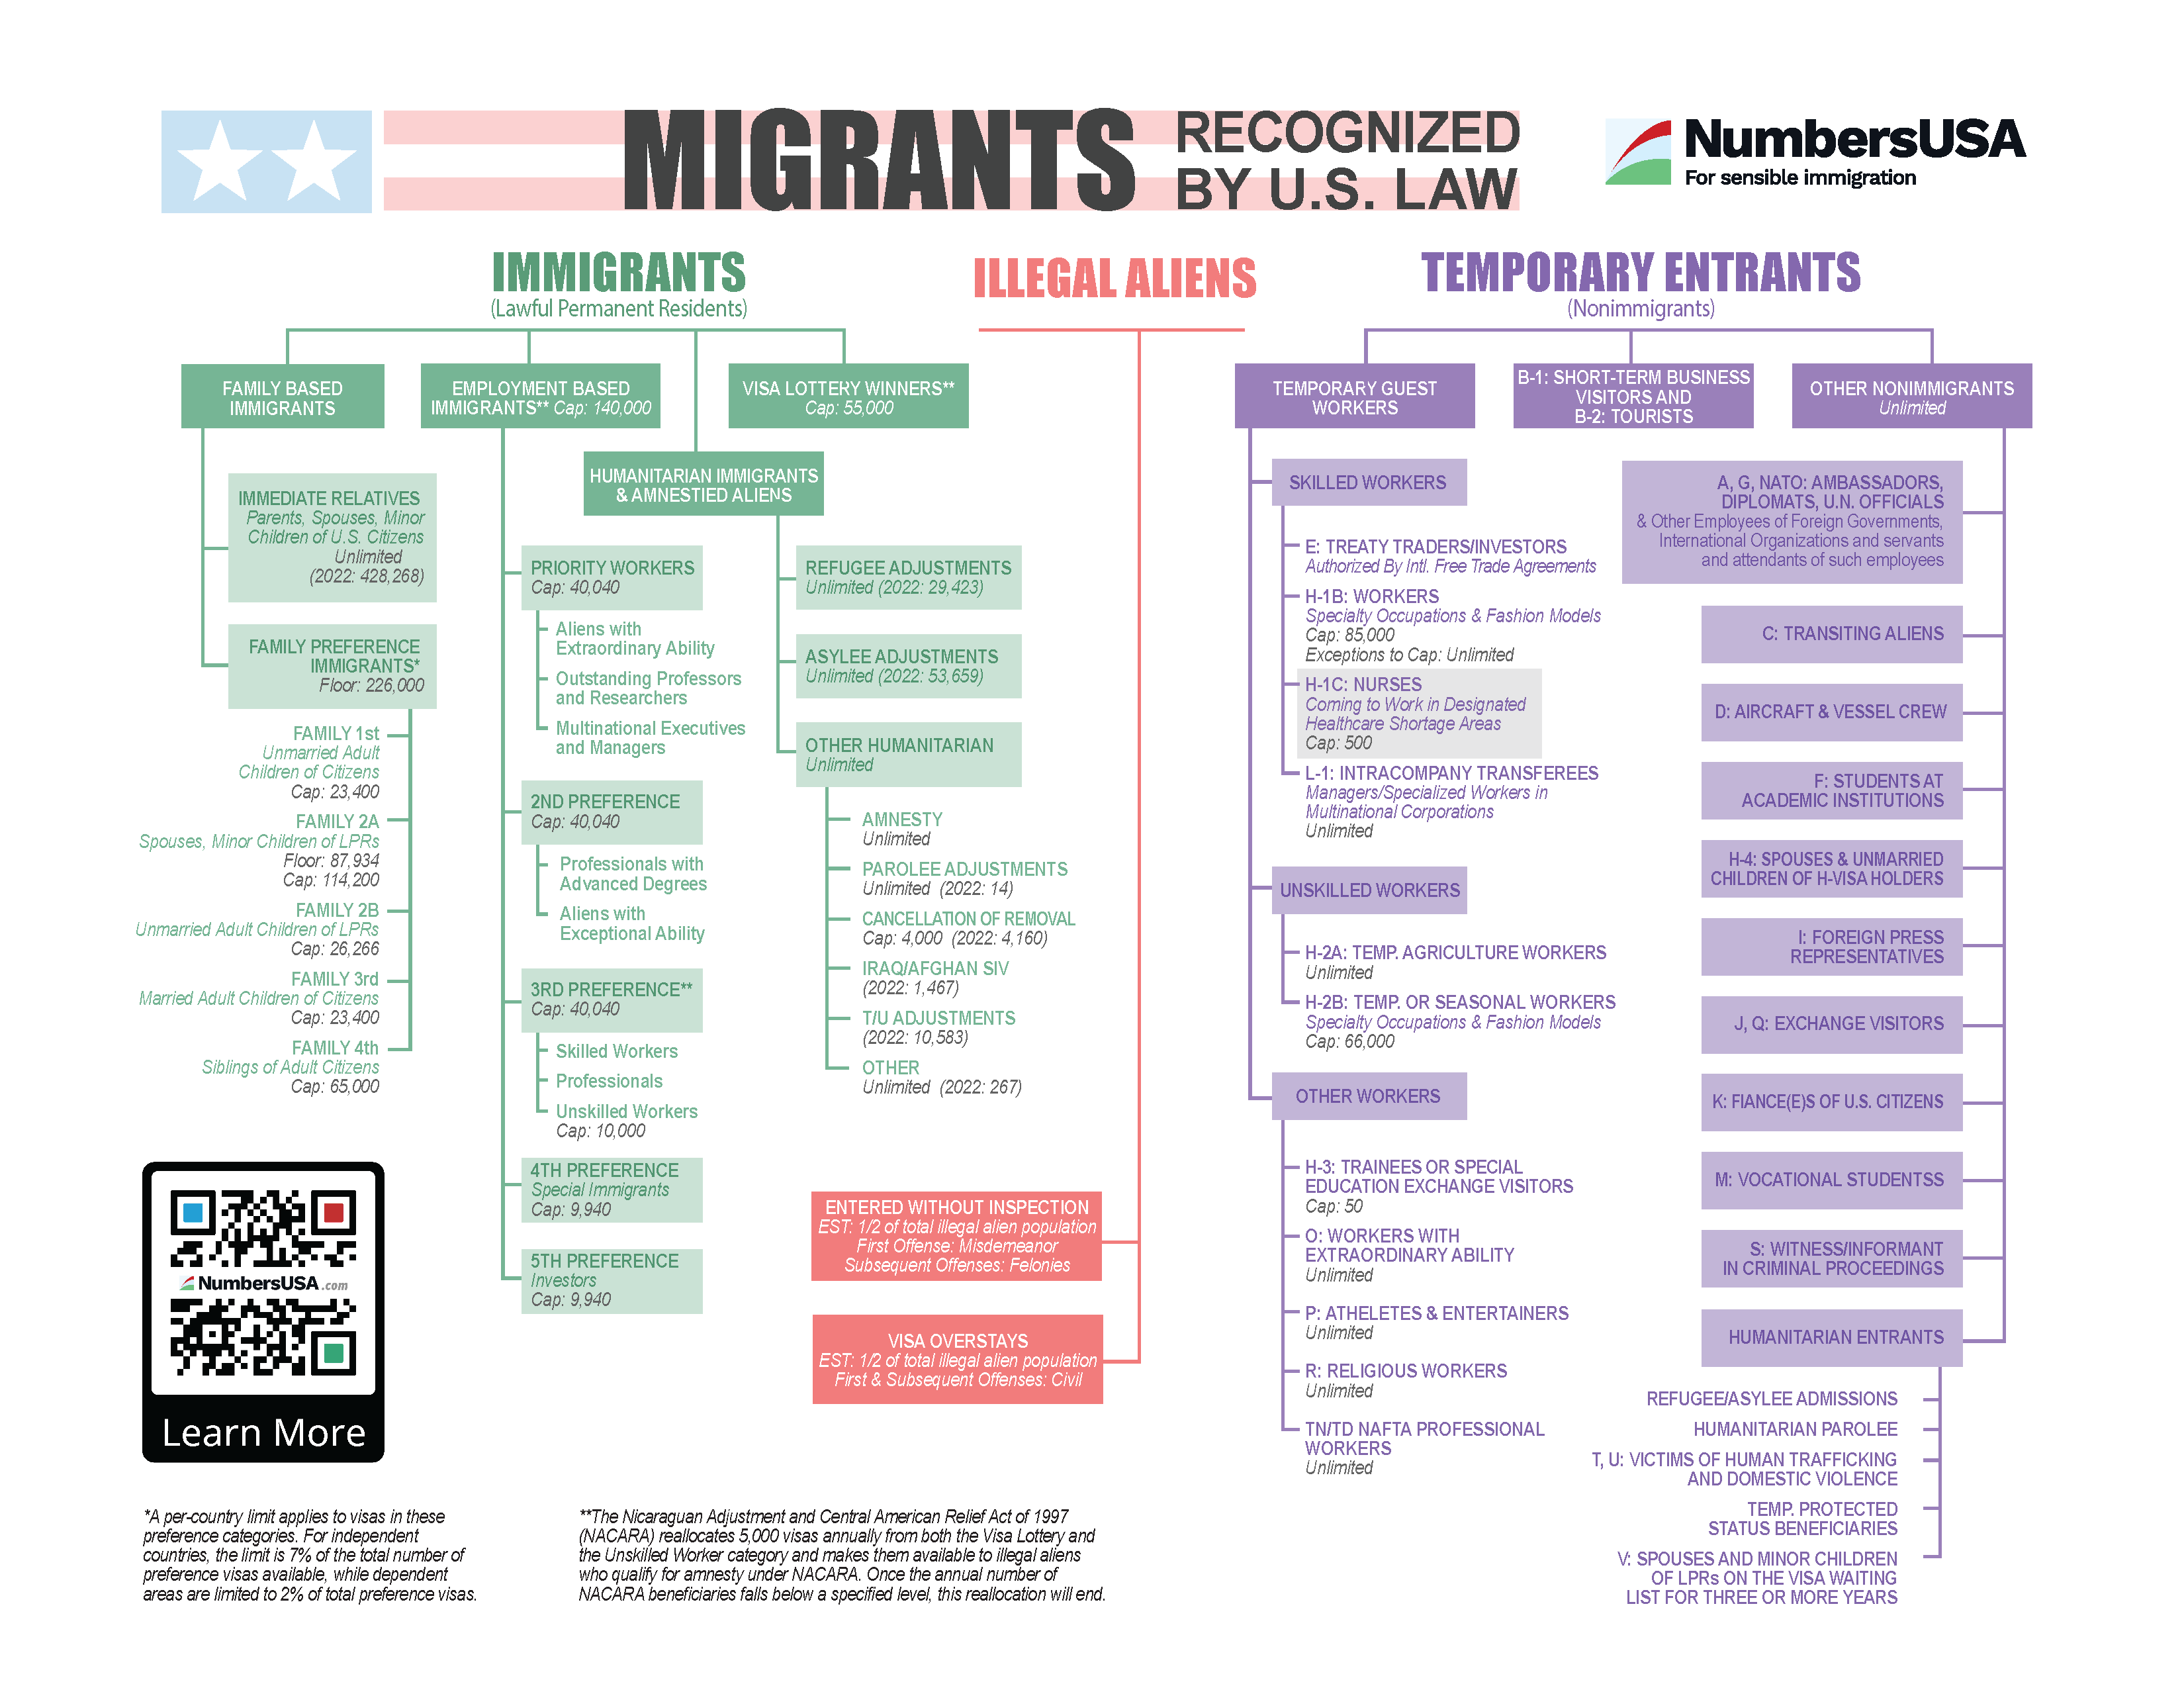
There are three categories of migrants and immigration recognized under U.S. law: permanent legal immigrants, temporary entrants, and illegal aliens. See the State Department Directory of Visa Categories. In recent years, Congressionally-mandated legal immigration has held relatively steady, while illegal and irregular immigration has skyrocketed.
Create Your Own Population Projections Under Different Immigration Scenarios
Recent net immigration levels have averaged nearly two and a half million annually. That puts the U.S. on pace to nearly double our population by the end of this century, as shown in the population projection below.
Numbers matter! To see how much, toggle below to increase or decrease annual legal and illegal immigration levels. Then see for yourself how that changes future population numbers.
By moving your cursor along the projection, you can see total population numbers for any year between 1950 and 2100.
Jump to
 Articles


 August 6, 2025